
Leaderboard
Is physical AI ready for real work?
Four leading models. One commercial task. Production metrics.
| # | Model |
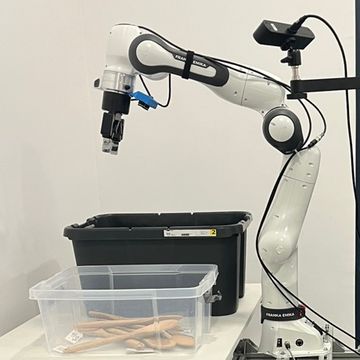 Benchmark
Single-arm pick-and-place
DROID · v1.0 |
|
|---|---|---|---|
| Success @ 30 s | Time per item | ||
| - | 99.0% ± 0.4 | 10.4 s ± 0.2 | |
| 1–2 | 46.1% ± 3.9 | 15.7 s ± 0.7 | |
| 1–2 | 44.4% ± 4.3 | 15.7 s ± 0.8 | |
| 3 | 42.5% ± 5.6 | 13.8 s ± 0.9 | |
| 4 | 16.3% ± 4.5 | 16.3 s ± 1.6 | |





Success @ 30 s is the share of items placed within 30 s of the previous item. Time per item is the mean time of those items. The rank orders the models by Success @ 30 s. A rank such as 1–2 means that chance can explain the difference between the time-to-success curves of the models in those places. ± is half the 95% range. Select a row to open the model's page.